

Around Santa Barbara, California, Bernard Friedman is known as “Mussel Man,” and he has been farming oysters and mussels offshore for the past 15 years. But he doesn’t just farm them; he also contributes to the science behind these bivalves. Friedman wants to work on the cutting edge of aquaculture, where satellite imagery and computer models can help him know when to harvest safe mussels and oysters.
Long before NASA satellites pass over coastal California each day, Friedman takes his 35-foot boat Perseverance out on the Pacific Ocean to survey his aquaculture farm. He hauls some of his shellfish up from 30 feet below to check on his harvest.
A few hours later (around noon daily), Earth-observing satellites harvest data from the same area. They scan the ocean surface from pole to pole, collecting data on temperature, chlorophyll, and other conditions within 1 square-kilometer parcels. Those data are fed into a computer model that forecasts the ecology in the region; specifically, how many potentially toxic algae are blooming near the surface.
Knowing when the waters off Santa Barbara contain harmful algae is critical to the success and safety of Friedman’s artisanal farm because the wrong kind of algae can make shellfish dangerous to eat. This has led him to work with NASA-funded scientists to combine what they can learn from his 25-acre aquaculture farm with what they can see from above.
As demand for seafood continues to rise, worldwide aquaculture production now rivals that of fishing for some wild species. Understanding the local environment is an important component of ensuring that an aquaculture harvest is safe and sustainable.
Mussels and oysters graze on algae, capturing it by filtering the water in which they live. The waters off California commonly include Pseudo-nitzschia, phytoplankton that can produce a neurotoxin called domoic acid. In high quantities, domoic acid can cause seizures in marine mammals; it also can upset stomachs and cause disorientation in humans. In one dramatic case, three Canadians died and 154 were hospitalized in 1987 for eating contaminated Prince Edward Island mussels.
When Friedman hauls his mussels onboard, he immediately tests their toxin levels with a kit. This quick test determines whether the shellfish are safe to send to market. He also sends weekly samples to the California Department of Public Health, which tracks the level of domoic acid up and down the coast. Because domoic acid levels rise and fall gradually, weekly monitoring helps the state take safety precautions, such as closing fishing sites when necessary and anticipating marine mammal strandings.
Previously thought to be a seasonal phenomenon, harmful algal blooms are now being detected throughout the year. Recent research shows that Pseudo-nitzschia is almost always present at moderate levels in the Santa Barbara Channel. But exactly when the levels will turn toxic is the big question.
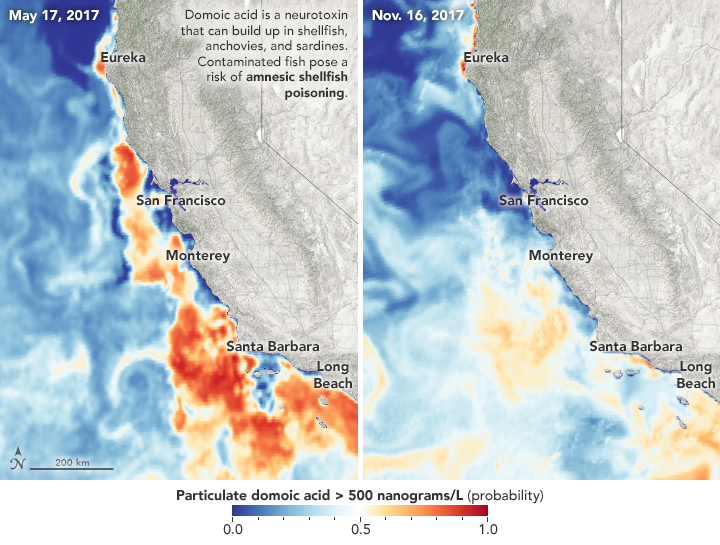
Scientists at the University of California, Santa Barbara, and University of California, Santa Cruz, began an effort in 2004 to map the times and locations of toxic events. The maps at the top of this page represent the output of their model during an extreme event in May 2017 and at a quieter time in November 2017.
Led by Clarissa Anderson (now at the Scripps Institution of Oceanography), the research team uses a combination of ocean color satellite imagery, routine domoic acid measurements, and a circulation model. They have found that the color of the ocean (an indicator of the amount of phytoplankton present), the temperature, the salinity, and the abundance of nutrients can help them make a reasonable prediction of the amount domoic acid in the water. For example, lower temperatures correspond to higher domoic acid; lower amounts of sililic acid can have the same effect.
Scientists monitor domoic acid levels by sampling phytoplankton routinely from piers along the California coast and from sites offshore (like Friedman’s mussel farm). These measurements are used to assess how well the model is detecting and predicting harmful algal blooms. So far, the model is notably good at detecting regional patterns, especially those associated with marine mammal strandings.
More problematic, however, is turning this 3-kilometer scale tool into the finer scale needed by a shellfish farmer like Friedman. The California–Harmful Algae Risk Mapping team is working to develop statistical models of oceanic physical and biological properties that can bridge the gap between predicting domoic acid levels at the large scale and the local scale.
Until that happens, Friedman will continue to rely on his intuition, gained from years of experience. He expects his best harvests between September and December, and he harvests the least during the most common harmful algal bloom season—generally between April and June. Technology will ultimately help him and other coastal fishermen know better when to cast off and when to stay on shore.
NASA Earth Observatory image by Joshua Stevens, using data from the California-Harmful Algal Risk Mapping (C-HARM) Model. Photo courtesy of Santa Barbara Mariculture. Story by Stephanie Schollaert Uz.