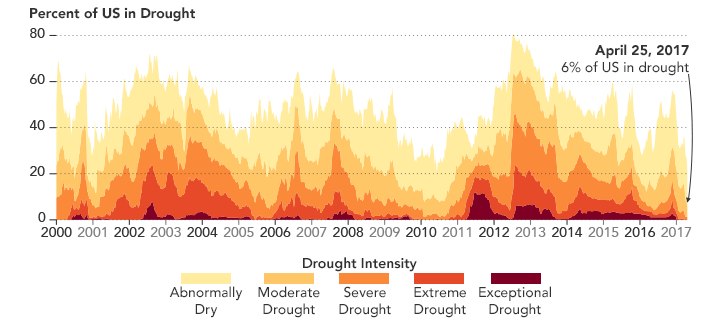

At the end of April 2017, just 6 percent of the United States was afflicted by drought, the lowest level in 17 years of analysis by the U.S. Drought Monitor. That’s a substantial turnaround from a few years ago, when long and short term droughts spread across much of the nation.
The news marks a downward trend from mid-2011, when many areas of the country began to experience drier-than-average weather. That summer, a headline in the U.S. Drought Monitor read: “‘Exceptional drought’ record for United States set in July.” By July 12, almost 12 percent of the contiguous United States was in an “exceptional” drought—including states as far flung as Oklahoma, New Mexico, and Florida.
“Two parts of the country that have composed a big portion of [its] drought area in the last decade, Texas and California, now have mostly normal conditions,” said Matthew Rodell, a hydrologist at NASA. “Texas’s drought broke in 2015, and California’s drought was alleviated by atmospheric rivers that brought heavy rains earlier this year. Combine that with recent precipitation across much of the northwestern and central parts of the nation, and the result is a much-wetter-than-normal map.”
The maps above show the U.S. as it looked on April 25, 2017, and roughly five years earlier, on August 7, 2012. Much of the country is currently drought-free (shown in white). One outlier, as shown in the image above, is Georgia (deep orange). Parts of the state remain in extreme drought, and water levels at the Lake Lanier reservoir have sunk 8 feet below full, according to authorities. Areas of Florida, too, continue to suffer from severe drought conditions—a stark contrast to early 2016, when it received record rainfalls.

At its driest on September 25, 2012, more than 20 percent of the country was observed to be in “extreme drought,” with more than 40 percent in “severe drought.” According to Drought Monitor standards, “severe” conditions mean likely crop or pasture losses, common water shortages, and water restrictions. “Extreme” drought conditions bring “major crop and pasture losses and “widespread water shortages or restrictions.”
Rainfall gave some respite in late 2012 before much of the country started drying out again. By 2014, half of the U.S. was experiencing some level of drought.
But conditions have since taken a 180-degree turn. Several seasons of heavy rains in the south and southeast increased soil moisture—but also caused flooding in some instances. States that were scorched by wildfires in 2016—parts of the Carolinas, Tennessee and Virginia—have been saturated with recent downpours. California, which endured a record-setting drought for several years, has soaked up the moisture in the past nine months. On April 7, 2017, Governor Jerry Brown lifted the state of emergency in most areas.
The graph above shows each of the drought categories on a timeline since the year 2000, when the Drought Monitor began compiling measurements. Data are gathered from more than 300 sources, including satellites and ground-based reports.
While plentiful rain signals an end to some record-breaking dry spells, multiple years of unusually hot, dry weather have left lasting damage, killing millions of trees and slowing down crop production.
NASA Earth Observatory images by Joshua Stevens, using data from the United States Drought Monitor at the University of Nebraska-Lincoln. Story by Pola Lem.