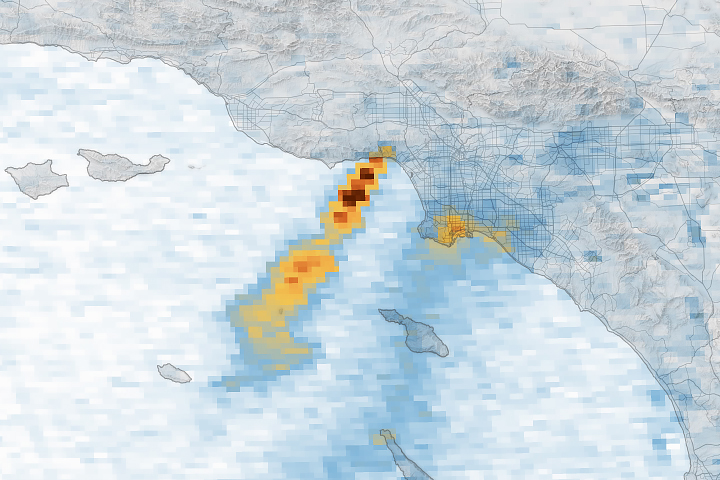
As people in Los Angeles went through the day on January 6, 2025, NASA’s TEMPO (Tropospheric Emissions: Monitoring of Pollution) sensor performed hourly east-to-west scans of North America. From its geostationary orbit 22,000 miles (35,000 kilometers) away, the pollution-measuring satellite observed the city's normal daily signature—a plume of nitrogen dioxide (NO2) emerging during the morning commute and lingering over the city for the rest of the day.
“On the day before the fire, NO2 built up hour by hour, and, like clockwork, drifted east in afternoon sea breezes, as we’ve observed it most days,” said Laura Judd, an atmospheric scientist at NASA’s Langley Research Center. Motor vehicles are major sources of the gas in Los Angeles, though other main sources include power plants, port facilities, and industrial sites.
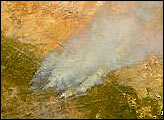
Air quality experts consider the reddish-brown gas, primarily a byproduct of fossil fuel combustion, to be hazardous to human health. It also contributes to the formation of ground-level ozone and particulate matter, also health hazards. The image above (upper left) shows NO2 over the city at 1:50 p.m. Pacific Time on January 6. It is one of nine images of the Los Angeles area captured by TEMPO over the course of the day and dozens more in the days that followed, some of which are shown above.
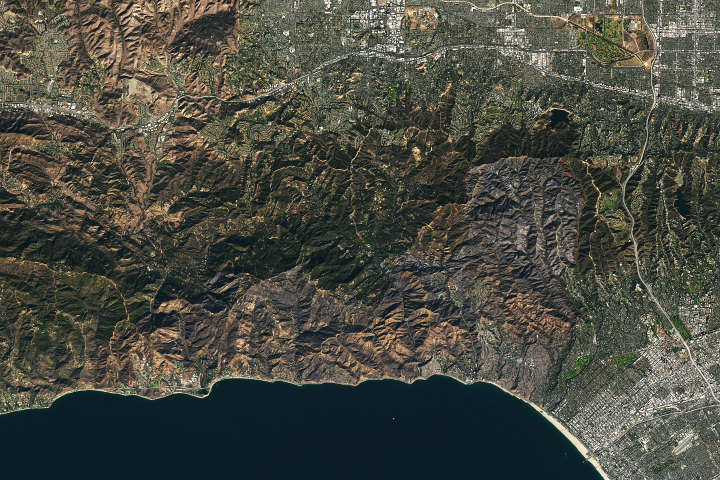
January 7 brought an ominous change in the weather. Strong Santa Ana winds streamed from the northeast, pushing the normal emissions that formed over the city that morning farther over the Pacific Ocean. As the morning progressed, a small source of NO2 sprung up west of downtown Los Angeles over the Pacific Palisades neighborhood. By the afternoon (upper right), winds had pushed the gas to the southwest, creating two distinct parallel plumes.
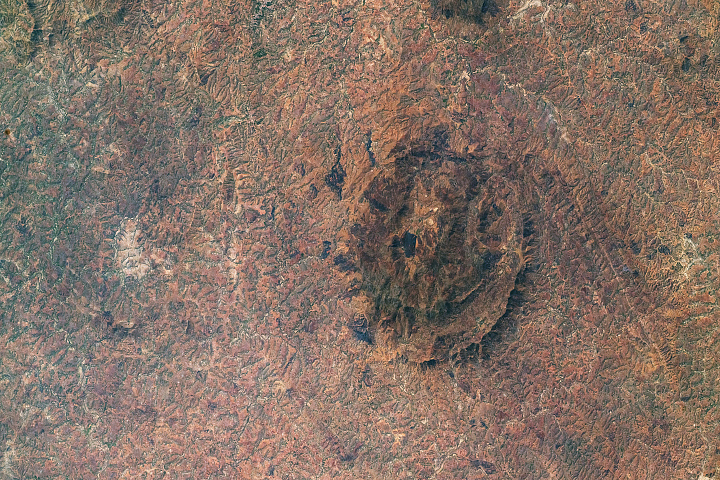
The source of the more westerly plume was the Palisades fire, now the fourth most destructive fire on record in California. By the afternoon of January 9 (lower left), another large wildland fire, the Eaton fire, raged near Pasadena, northeast of Los Angeles. The westward blowing winds caused NO2 to stream over the heart of the city on its way out to sea.
TEMPO detected particularly strong NO2 plumes as the fires raged between January 8 and 11. By January 12 (lower right), firefighters had made enough progress that the NO2 signal from the fires waned and urban pollutants began to dominate emissions again. As of January 16, Cal Fire reported the Palisades fire was 27 percent contained, and the Eaton fire was 55 percent contained.
“This is a map of NO2, but we know it was accompanied by a variety of other trace gases and airborne particulates also found within wildland fire smoke plumes,” said Aaron Naeger, an atmospheric scientist with the Short-term Prediction Research and Transition Center at NASA’s Marshall Space Flight Center. Among them: elevated levels of carbon monoxide, formaldehyde, and fine particulate matter (PM2.5).
The Environmental Protection Agency’s AirNow program and the South Coast Air Quality Management District provide localized, nose-level information about air quality collected from ground monitors while TEMPO collects complementary columnar NO2 data with broad spatial coverage from its vantage point in orbit.
Researchers are currently working on feeding TEMPO data into national and state air quality monitoring and forecasting systems, but TEMPO observations of NO2 and formaldehyde are already being ingested into data browsing platforms from NASA Worldview, SPoRT, and the Harvard-Smithsonian Center for Astrophysics and used by researchers and others.
People in the vicinity of an NO2 plume mapped by TEMPO can enter their zip code into AirNow and get more details about local air quality conditions, said Naeger. During the height of the burning, AirNow data indicated that several neighborhoods in Los Angeles faced unhealthy air.
NASA Earth Observatory image by Michala Garrison, using TEMPO data from NASA Earthdata. Story by Adam Voiland.