
Today’s Image of the Day includes excerpts from our recent feature: Peering Through the Sands of Time.
As satellite imaging—natural-color, false-color, and radar—has evolved and became more accessible, a scientific community that once measured the rise and fall of civilizations based on a few dig sites now discovers landscapes and features hundreds of kilometers long. Archaeological research now includes expertise from geography and earth science, and for some archaeologists, remote sensing has become as valuable as carbon dating.
But space archaeology might not have taken off without Tom Sever. In the late 1970s, while working on a project for an environmental non-profit, Sever went to Peru to retrace paths followed by 16th century Spanish conquistador Francisco Pizarro. It took three months for Sever and a colleague to walk one-and-a-half of Pizarro’s 41 lines. He remembers thinking: “There has to be a better way to do this.”
He read an article about imaging work being done at NASA’s Stennis Space Center in Mississippi, and he decided to apply to the program. “Traditional archaeology wasn’t going to work for me to answer the questions I had,” he said. In 1981, he joined the small group of programmers at Stennis who were learning to interpret satellite images even as “NASA was inventing remote sensing.” Archaeologists had only just started to approach the agency for help in surveying sites.
In his first year at Stennis, Sever worked by day scouring imagery to make agricultural maps. But by night, he was chipping away at his passion project: mapping archaeological sites. Using several tools—the Thermal Infrared Multispectral Scanner (TIMS), the Calibrated Airborne Multispectral Scanner (CAMS), and the Advanced Terrestrial Land Applications Sensor (ATLAS)—he charted Chaco Canyon, New Mexico (see the top of this page), home to the highest concentration of pueblos in the southwestern United States. Poring through images, Sever found ancient roadways that led to sacred sites—roads 30 feet wide and “straight as an arrow.” Fieldwork by ground-based teams verified the finds. “It was ten for ten.”
Space archaeology would eventually become Sever’s full-time job, and in three decades at NASA, other sensors would slowly fill out his remote sensing toolkit. Perhaps the most important was Landsat, a partnership between NASA and the U.S. Geological Survey. Whereas airborne sensors relied on data collected on sporadic and limited flights, Landsat satellites have provided continuity with new digital images collected from the same angle every 16 days.
Being able to see traces of human history in satellite imagery is dependent on what details can be resolved on a given image. There are four main types of image resolution: spatial, spectral, radiometric, and temporal.
Spatial resolution is the type that most of us are most familiar with: how detailed is an image and what are the smallest features that can be seen? Over the past 45 years, Landsat has improved its spatial resolution from a pixel size of 79 meters to 30 meters to 15 meters. While this is much coarser than modern commercial satellites, the Landsat images serve an important purpose in helping archaeologists examine the broad context of an environment. Also, decades of Landsat data are freely available on the web.

Spectral resolution refers to which parts of the electromagnetic spectrum a given sensor measures. Spectral resolution has increased with each generation of Landsat satellites. The current iteration, Landsat 8, makes measurements in eleven discreet portions of the electromagnetic spectrum from the visible to thermal infrared.
Regions beyond the visible spectrum, especially the near infrared and shortwave infrared, have played outsize roles in space archaeology mainly because they can show where water has influenced the landscape. For example, Landsat infrared data has helped to detect water sources at ancient mining sites on the West Coast of Sinai; ancient settlements and canals in northeast Thailand; prehistoric Hohokam irrigation features in Arizona’s Salt River; and irrigation features at the ancient Sri Ksetra site in Myanmar. Where water goes, so do humans.
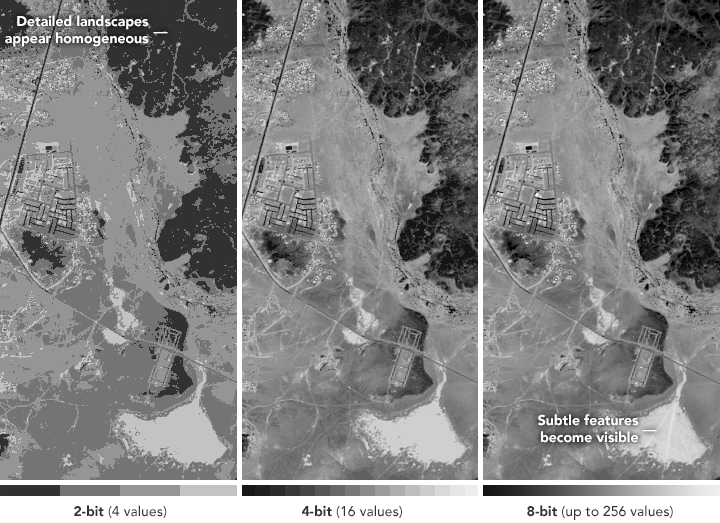
Radiometric resolution is perhaps the most esoteric. It describes a sensor’s ability to discriminate differences in energy (radiance). The better the radiometric resolution, the more sensitive the sensor is to small differences in energy. Radiometric resolution is determined by multiple factors, chief among these are the saturation radiance—the “brightest“ thing detectors can measure—and how the radiance measurements are quantized (turned into a digital bit stream).
Early Landsat satellites had only 6-bit quantization, meaning that everything from the darkest to the brightest objects measured had to be described with 64 shades of gray; this increased to 8-bit data (256 shades of gray) with the second- and third-generation satellites. Today Landsat 8 has 12-bit data (4,096 shades of gray). The trio of images of Saudi Arabia (above) demonstrate how bit depth can translate into refined image detail.
In the field of archaeology time is central: how long ago did something exist? Can researchers find important sites before looters do? In remote sensing, the time domain is described by temporal resolution: how often does a satellite revisit and collect data over a site.
Since 1972, a Landsat satellite has flown over each point on Earth every 6 to 18 days. In the first two decades of the program, a few hardware malfunctions and limits on satellite power and download locations meant that data was not always collected and stored on passes outside of North America. Nevertheless, after 45 years of Landsat operations, the seven millionth Landsat scene was recently added to the U.S. archive.
After four decades of advancing technology, Landsat 8 now collects data almost continually around the globe. After just 4.5 years in orbit, Landsat 8 has already contributed a million scenes to the archive. And data from Landsat 9 is on the horizon, as the satellite is slated for a December 2020 launch.
NASA Earth Observatory images by Joshua Stevens, using Landsat data from the U.S. Geological Survey. Story by Pola Lem and Laura Rocchio.