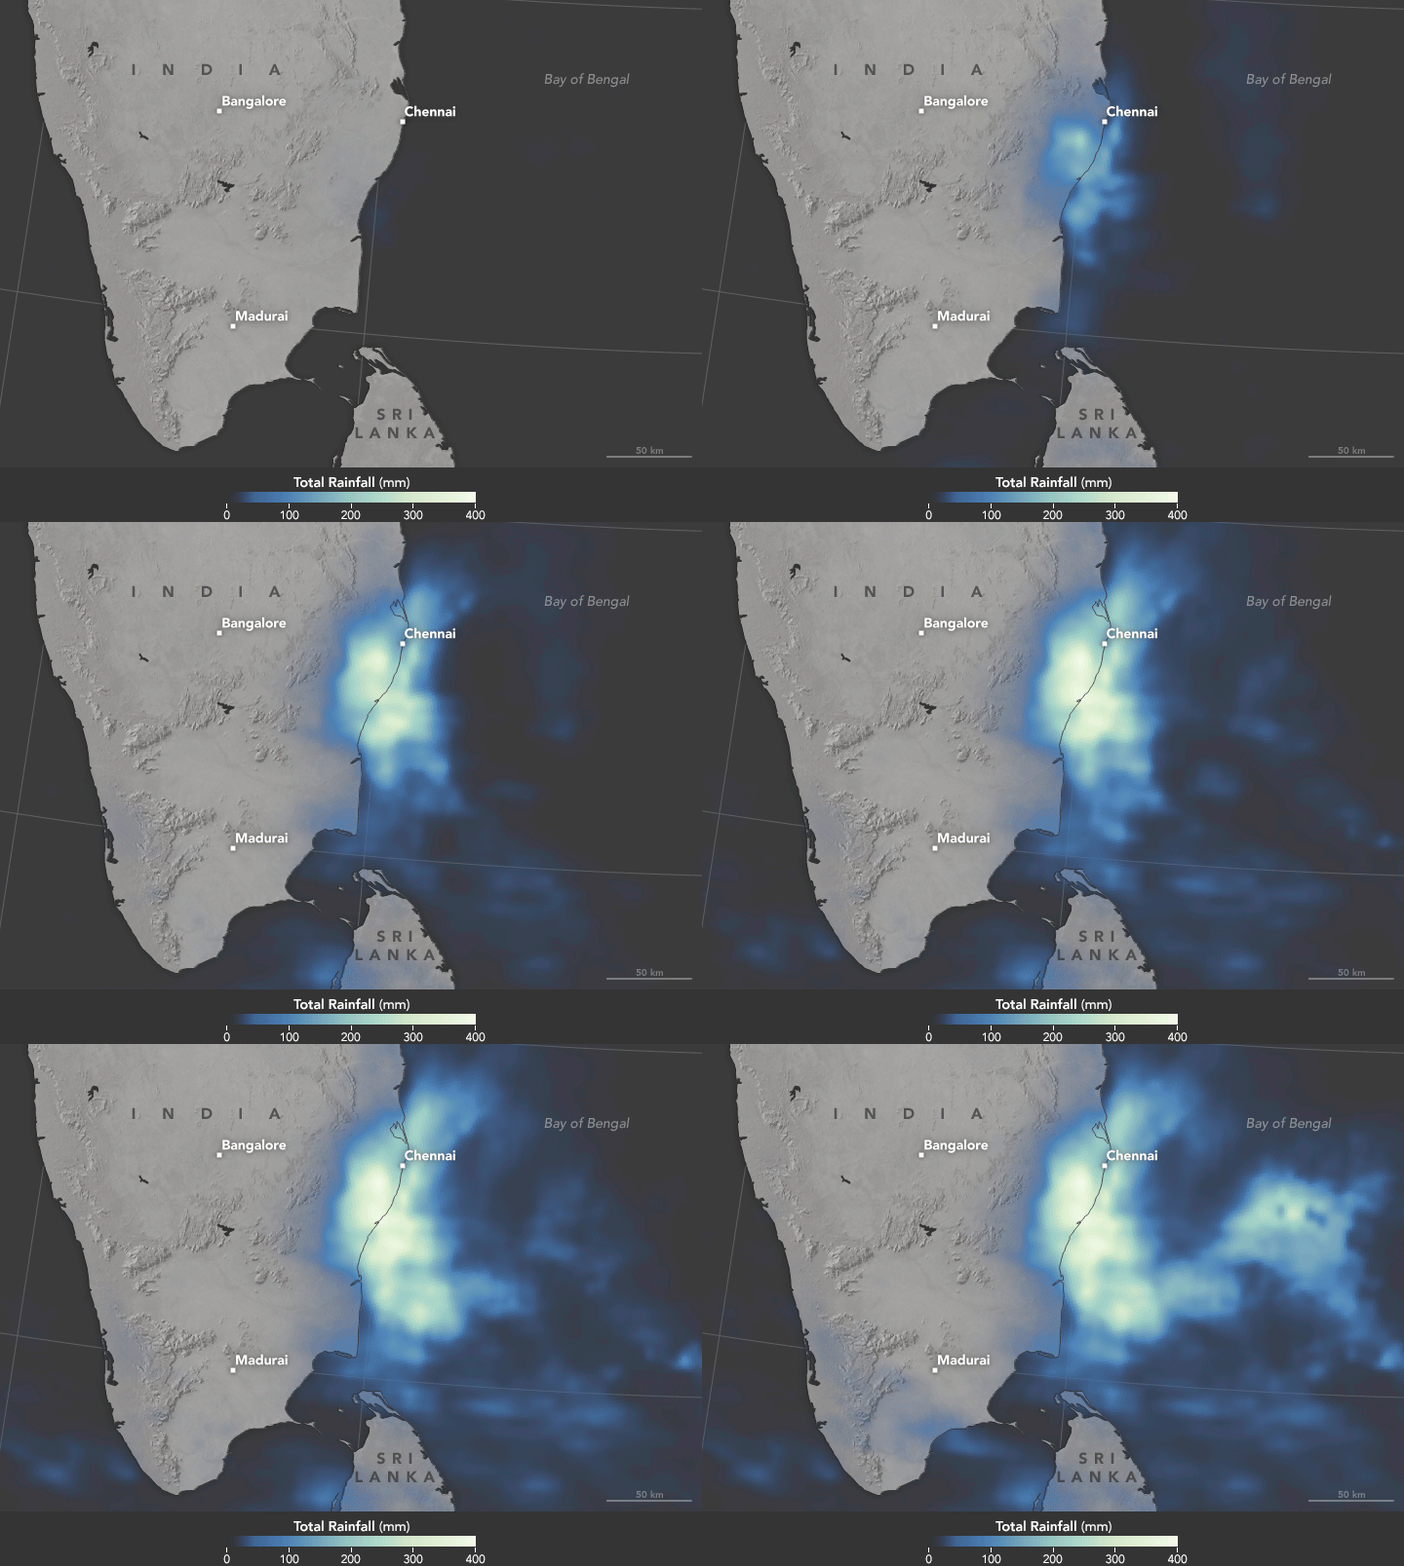


On December 1–2, 2015, the Indian city of Chennai received more rainfall in 24 hours than it had seen on any day since 1901. The deluge followed a month of persistent monsoon rains that were already well above normal for the Indian state of Tamil Nadu. At least 250 people have died, several hundred have been critically injured, and thousands have been affected or displaced by the flooding that has ensued.
The animation above provides satellite-based estimates of rainfall over southeastern India on December 1–2, accumulating in 30–minute intervals. The rainfall data come from the Integrated Multi-Satellite Retrievals for GPM (IMERG), a product of the Global Precipitation Measurement mission. The brightest shades on the maps represent rainfall totals approaching 400 millimeters (16 inches) during the 48-hour period. These regional, remotely-sensed estimates may differ from the totals measured by ground-based weather stations. According to Hal Pierce, a scientist on the GPM team at NASA’s Goddard Space Flight Center, the highest rainfall totals exceeded 500 mm (20 inches) in an area just off the southeastern coast.
Meteorologists in India and abroad attributed the rains to a super-charged northeast monsoon. In the winter, prevailing winds blow from northeast to southwest across the country, which tends to have a drying effect in most places, particularly inland. But those northeasterly winds also blow over the warm waters of the Bay of Bengal, where they evaporate a great deal of moisture from the sea and dump it over southern and eastern India. Coastal eastern India receives 50 to 60 percent of its yearly rainfall during this winter monsoon.
In 2015, this pattern was amplified by record-warm seas and by the long-distance effects of El Niño. The city of Chennai recorded 1218.6 millimeters (47.98 inches) of rain in November 2015, according to Weather Underground blogger Bob Henson. India’s meteorological department noted that rainfall was 50 to 90 percent above normal in the eastern states. Then 345 millimeters (13.58 inches) more fell on Chennai in the December 1–2 storm, which was fueled by a low-pressure system offshore.
NASA Earth Observatory map by Joshua Stevens, using IMERG data provided courtesy of the Global Precipitation Mission (GPM) Science Team's Precipitation Processing System (PPS). Caption by Mike Carlowicz.