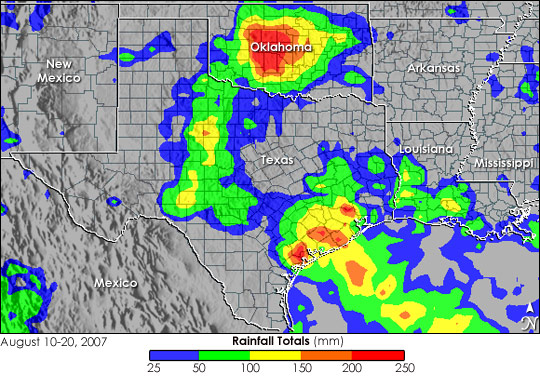


Tropical Storm Erin was never a big storm, but it unleashed torrential rains over the Southern Plains as it moved inland between August 16 and August 19, 2007. This image shows rainfall totals along Erin’s track from August 10 through August 20. The image comes from the near-real-time, Multi-satellite Precipitation Analysis (MPA), produced at Goddard Space Flight Center. The analysis is based in part on measurements taken by the Tropical Rainfall Measuring Mission (TRMM) satellite.
A band of heavy rain follows Erin’s path from initial landfall along the central Texas Gulf coast into West Texas and central Oklahoma, where Erin persisted as a long-lasting tropical depression. The highest rainfall totals for the period (shown in red) are centered over central Oklahoma, where as much as 200 to 250 millimeters (around 8 to 10 inches) of rain fell. The central Texas Gulf Coast, where Erin made landfall, also received a substantial amount of rain, on the order of 100 to 200 mm (around 4 to 8 inches). A swath of two-inch-plus amounts (green areas) extends up through central Texas.
As of August 20, up to 7 people had died in floods caused by Erin’s rains in Texas and Oklahoma, reported the New York Times. Before Erin, the summer of 2007 had already brought record rainfall and flooding across parts of the Southern Plains. Meanwhile, a separate line of storms was draped across the Upper Midwest.
TRMM is a joint mission between NASA and the Japanese space agency, JAXA.
Image produced by Hal Pierce (SSAI/NASA GSFC), and caption by Steve Lang (SSAI/NASA GSFC).