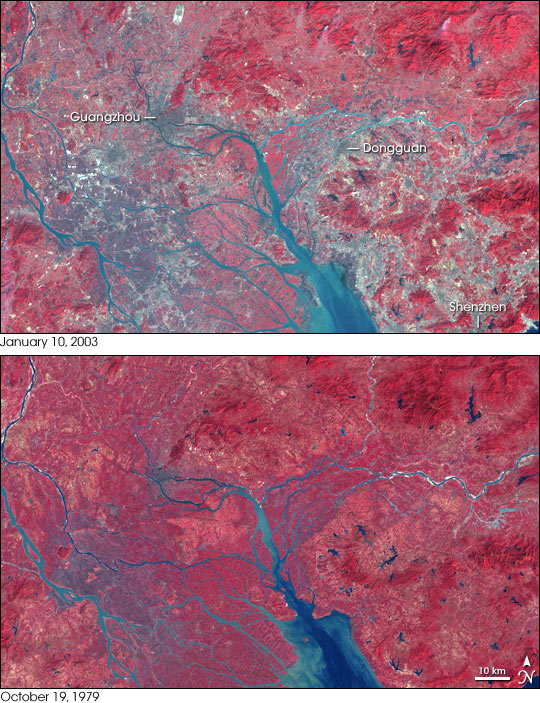


By 1979, China’s Pearl River Delta had seen little urbanization. The following year, however, the landscape began to change. In 1980, the People’s Republic of China established a special economic zone, Shenzhen, to attract foreign investment in this area just north of Hong Kong. In the years that followed, buildings and paved surfaces replaced plants at a rapid pace around the river delta. Not only did the urbanization change the landscape, it changed the weather.
These images compare the Pearl River Delta on October 19, 1979 (observed by NASA’s Landsat 3), and January 10, 2003 (observed by NASA’s Landsat 7). In these false-color images, red indicates vegetation, blue indicates water, pale blue indicates shallow or sediment-laden water, and gray indicates buildings and paved surfaces. The difference between 1979 and 2003 is striking, with few structures interrupting the lush vegetation in the earlier image, and urban areas dominating the later one.
According to the Hong Kong Observatory, January is typically the driest month of the year, and the January 10, 2003, image captures a drier landscape. Its increased dryness, however, results from more than a seasonal difference. A study published in the Journal of Climate in May 2007 examined Landsat satellite observations of urbanization from 1988 to 1996, and temperature and precipitation records from 16 weather stations along the Pearl River Delta. The study found that increased urbanization had decreased rainfall around the delta during the dry season, or winter.
The researchers explained that once roads, buildings, and parking lots replace vegetation, the soil cannot retain as much water. As a result, the local atmosphere is less humid, leading to less precipitation. The effect is most pronounced in the winter months; in the summer, the Asian monsoon overpowers the effect of urbanization.
In drier places, the effect of urbanization on rainfall differs. Research by Marshall Shepherd at NASA’s Goddard Space Flight Center in 2005 and 2006 found that rainfall actually increased downwind of some U.S. cities.
NASA image created by Jesse Allen
Landsat 3 MSS data provided by the University of Maryland’s Global Land Cover Facility.
Landsat 7 ETM+ data provided courtesy of the Landsat Project Science Office, NASA/GSFC.