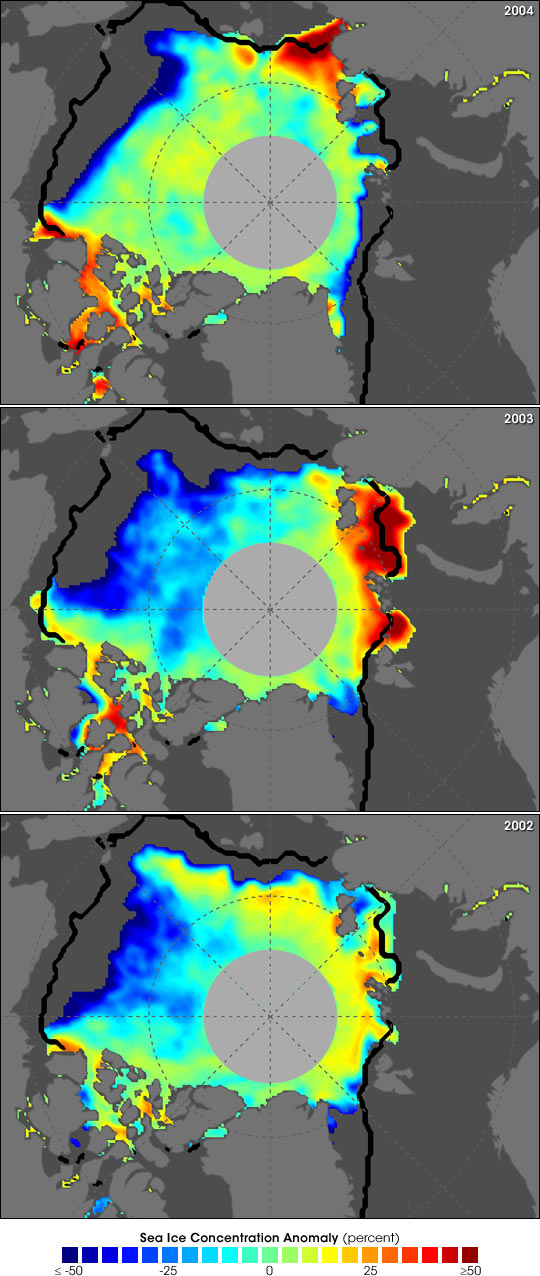


Arctic sea ice has declined sharply over the last three years. For years, scientists at the University of Colorado at Boulder have been tracking the extent of sea ice across the Arctic Circle. Every September researchers produce a composite map of Arctic sea ice and compare that year’s measurements to the longer-term average. September is the end of the summer melt period and so measurements made during that month provide an important indicator of the state of Arctic ice cover. This year scientists found that ice extent in September 2004 was 13.4 percent less than average. They observed similar declines in September 2003, when ice cover was 12 percent less than average, and in September 2002, when ice cover was at its lowest extent ever observed—15 percent below average. That year, the loss in ice extent equaled an area roughly twice the size of Texas.
The false colors in the maps above show the loss of sea ice cover in September for each of the last three years. The colors represent a value known as “sea ice concentration anomaly.” Derived from satellite-based Special Sensor Microwave/Imager (or SSM/I) data, the images show how the concentration of ice compares to average Arctic ice conditions. Yellow and red hues show where the ice had higher concentrations than average, while light and dark blue shades show less-than-average concentrations. Teal represents little or no difference. Gray areas show where no data are available. (Note: anomalies are not calculated north of the circle centered around the North Pole because there are no satellite data for this region prior to 1988. Satellite measurements of Arctic sea ice began in November 1978.)
In their October 4, 2004, press release, University of Colorado scientists reported that the decline in Arctic Sea ice points to “acceleration of the downward trend.” They said one possible explanation for the continuing loss of sea ice in this region is that climate warming from human activities like the burning of fossil fuels is becoming more apparent. “Climate models are in general agreement that one of the strongest signals of greenhouse warming will be a loss of Arctic sea ice,” stated Mark Serreze, of the U.S. National Snow and Ice Data Center (NSIDC). “Some [models] indicate complete disappearance of the summer sea ice cover by 2070.”
For more information, please see Arctic Sea Ice Decline Continues.
Images courtesy National Snow and Ice Data Center