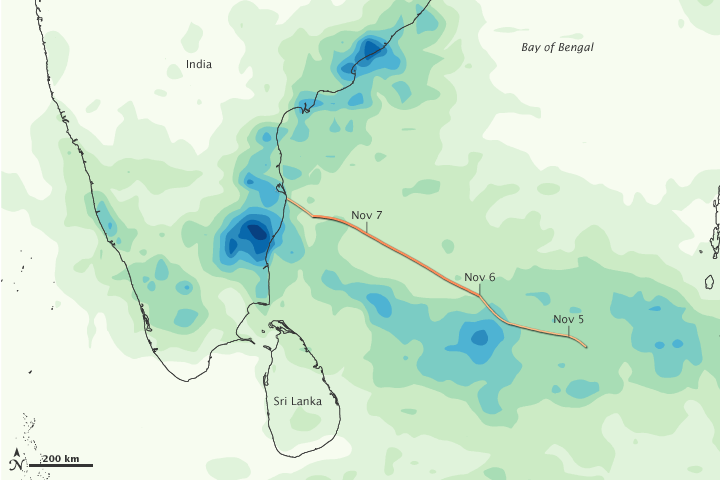


Cyclone Jal brought heavy rains to the Bay of Bengal and the southeastern coast of India in early November 2010. This color-coded map shows total rainfall over the region from November 1–7. The heaviest rainfall—more than 600 millimeters or nearly 24 inches—appears in dark blue. The lightest rainfall—less than 75 millimeters or 3 inches—appears in light green. Superimposed on the map is the storm track, with darker shades of orange corresponding with greater storm intensity.
A band of heavy rainfall ran parallel to the November 5–7 storm track. Especially heavy rain occurred south and west of where Jal made landfall on India’s southeastern coast. The Press Trust of India attributed 11 deaths in Andhra Pradeshstate to heavy rains from Jal.
This image is based on data from the Multisatellite Precipitation Analysis produced at NASA's Goddard Space Flight Center, which estimates rainfall by combining measurements from many satellites and calibrating them using rainfall measurements from the Tropical Rainfall Measuring Mission (TRMM) satellite.
NASA Earth Observatory image by Jesse Allen, using near-real-time data provided courtesy of TRMM Science Data and Information System at Goddard Space Flight Center. Caption by Michon Scott.