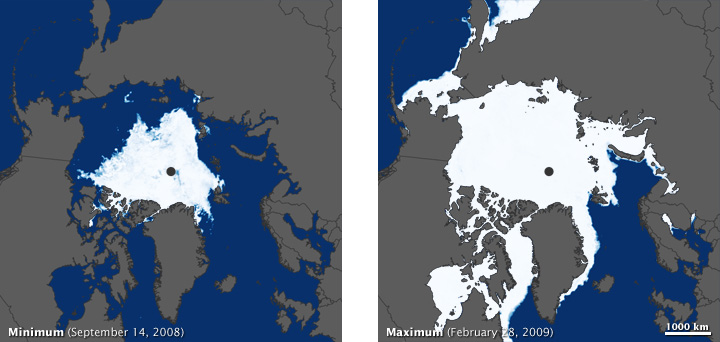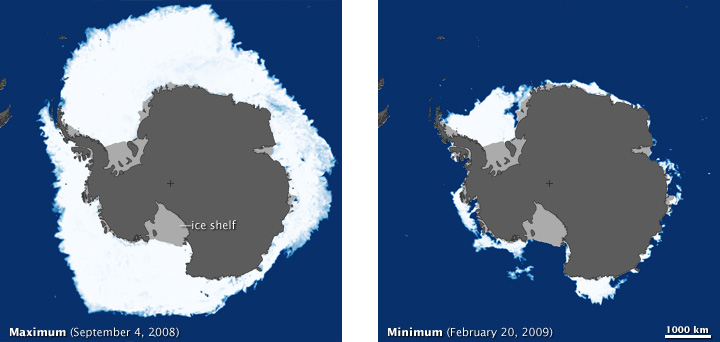


Because of differences in geography and climate, the amount, location, and natural variability of sea ice in the Arctic and the Antarctic are different. The most obvious difference is the timing of maximum and minimum ice extent, illustrated here with satellite data from the most recent seasons. The top row shows sea ice concentration in the Arctic during the September 2008 summer minimum (left) and the February 2009 winter maximum (right). Ice concentrations range from pale blue (low) to white (total ice cover). The bottom row shows Antarctic sea ice during the same months: September 2008 (left) is the most recent winter maximum, while February 2009 (right) is the most recent summer minimum. The maps are based on observations from the Advanced Microwave Scanning Radiometer for EOS (AMSR-E) on NASA’s Aqua satellite.
Since 1979, satellites have provided a consistent, continuous record of sea ice. Through 2008, annual average sea ice extent in the Arctic fell by about 4 percent per decade relative to the 1979–2000 average. The amount of ice remaining at the end of summer declined even more dramatically—more than 11 percent per decade. Declines are occurring in every geographic area, in every month, and every season. Natural variability and rising temperatures linked to global warming appear to have played a role in this decline.
In some ways, the Antarctic is the precise opposite of the Arctic. The Arctic is an ocean basin surrounded by land, while the Antarctic is land surrounded by ocean. In the Antarctic, sea ice fringes the entire continent and can expand across a bigger ocean area in the winter, but it can't reach the South Pole. In the summer, it is much freer than Arctic sea ice to drift away into warmer waters and melt. Because of this geography, the Antarctic’s sea ice coverage is larger than the Arctic’s in winter, but smaller in the summer.
Antarctic sea ice trends during the satellite era are smaller and more complex than Arctic trends. Through 2008, the total annual Antarctic sea ice extent increased about 1 percent per decade, but the trends were not consistent for all areas or all seasons. The variability in Antarctic sea ice patterns makes it harder for scientists to explain Antarctic sea ice trends and to predict how Southern Hemisphere sea ice may change as greenhouse gases continue to warm the Earth.
The Earth Observatory’s new Sea Ice Factsheet explains how sea ice forms and why it is so important in the Earth system. The article also describes natural climate patterns that influence Arctic and Antarctica sea ice, current status and trends of ice in each hemisphere, and how rising temperatures may influence sea ice in the future.
NASA maps by Jesse Allen, based on AMSR-E data from NSIDC. Caption by Rebecca Lindsey.