A NASA sensor recently brought a new approach to battling wildfire, providing real-time data that helped firefighters in the field contain a blaze in Alabama. Called AVIRIS-3 (Airborne Visible Infrared Imaging Spectrometer 3), the instrument detected a 120-acre fire on March 19 that had not yet been reported to officials.
As AVIRIS-3 flew aboard a King Air B200 research plane over the fire about 3 miles (5 kilometers) east of Castleberry, Alabama, a scientist on the plane analyzed the data in real time and identified where the blaze was burning most intensely. The information was then sent via satellite internet to fire officials and researchers on the ground, who distributed images showing the fire’s perimeter to firefighters’ phones in the field.
All told, the process from detection during the flyover to alert on handheld devices took a few minutes. In addition to pinpointing the location and extent of the fire, the data showed firefighters its perimeter, helping them gauge whether it was likely to spread and decide where to add personnel and equipment.
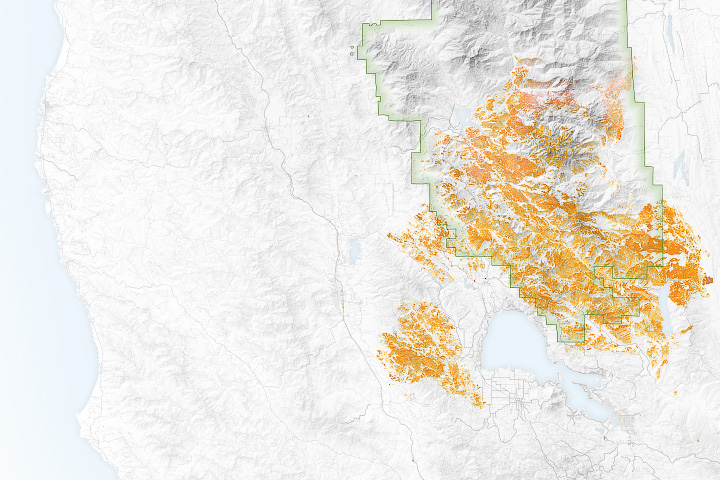
“This is very agile science,” said Robert Green, the AVIRIS program’s principal investigator and a senior research scientist at NASA’s Jet Propulsion Laboratory (JPL), noting AVIRIS-3 mapped the burn scar left near JPL by the Eaton Fire in January. The AVIRIS-3 sensor belongs to a line of imaging spectrometers built at JPL since 1986. The instruments have been used to study a wide range of phenomena—including fire—by measuring sunlight reflecting from the planet’s surface.
Observing the ground from about 9,000 feet (3,000 meters) in altitude, AVIRIS-3 flew aboard several test flights over Alabama, Mississippi, Florida, and Texas for the NASA 2025 FireSense Airborne Campaign. Researchers flew in the second half of March to prepare for prescribed burn experiments that took place in the Geneva State Forest in Alabama on March 28 and at Fort Stewart-Hunter Army Airfield in Georgia from April 14 to 20. During the March span, the AVIRIS-3 team mapped at least 13 wildfires and prescribed burns, as well as dozens of small hot spots (places where heat is especially intense)—all in real time.
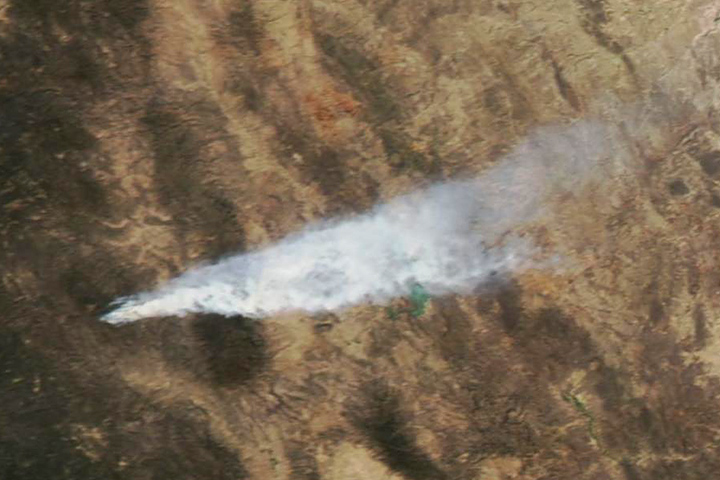
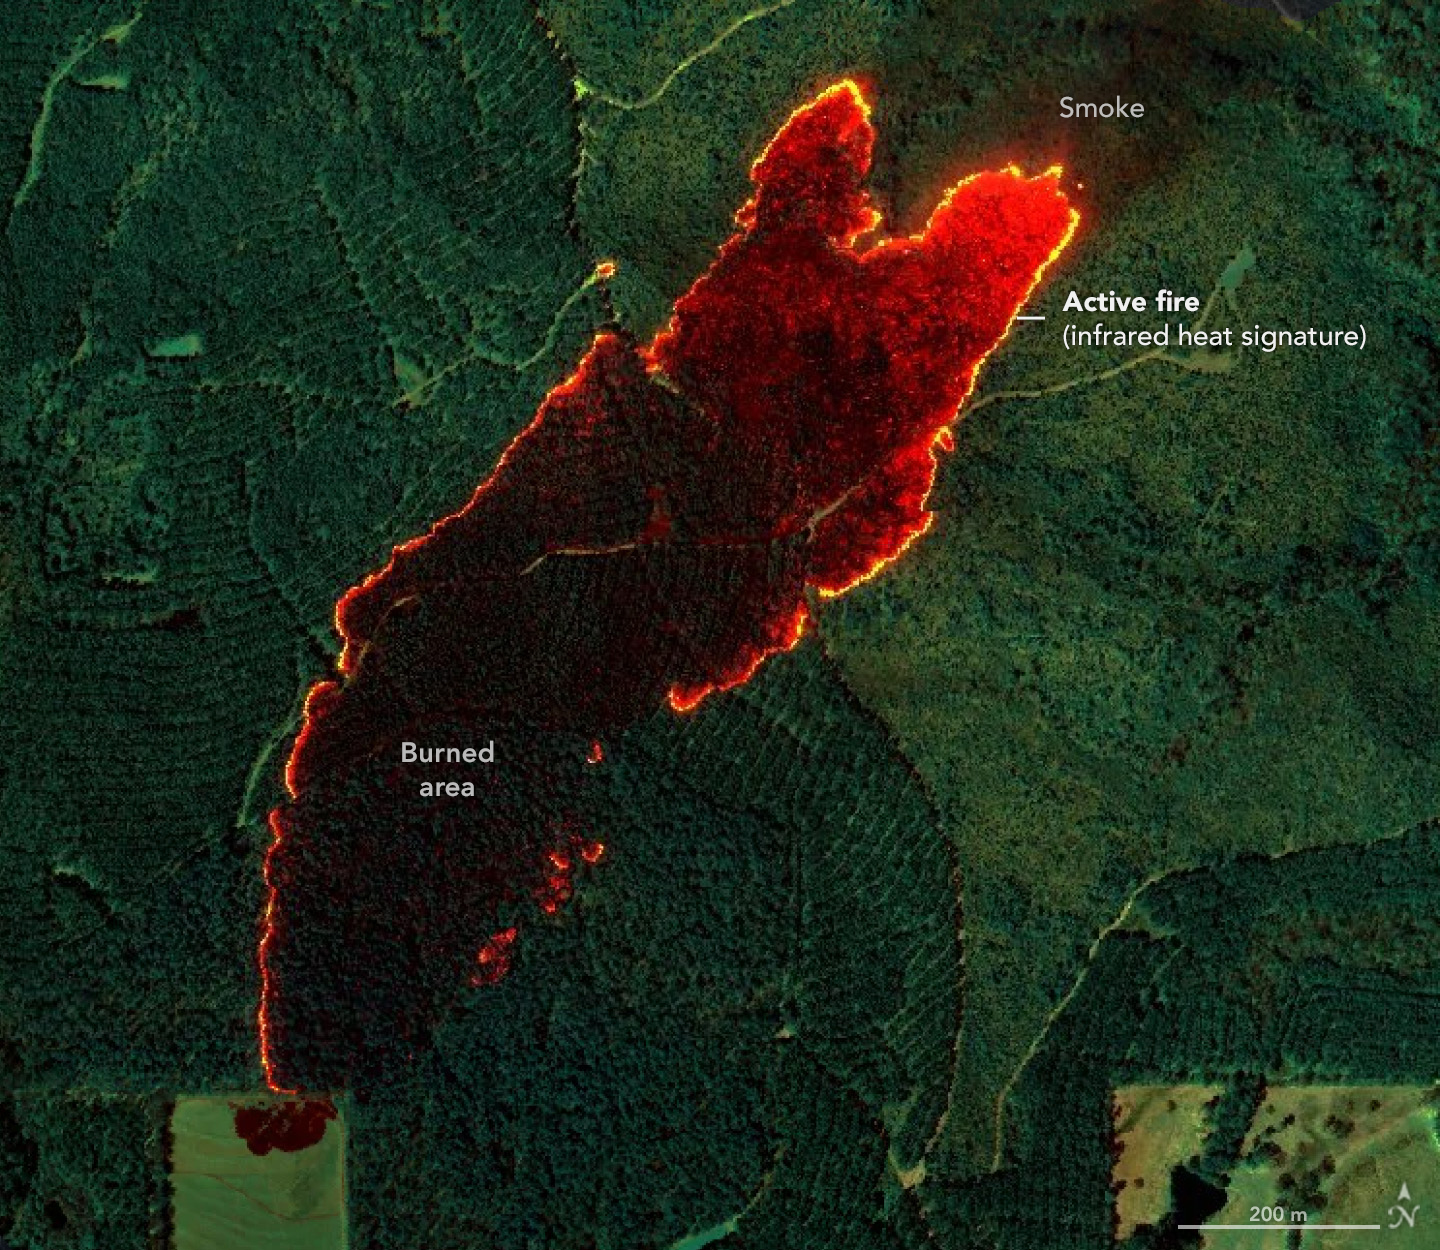
For the Castleberry Fire, shown at the top of this page on March 19, 2025, having a clear picture of where it was burning most intensely enabled firefighters to focus on where they could make a difference—on the northeastern edge.
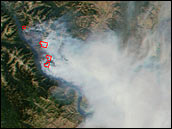
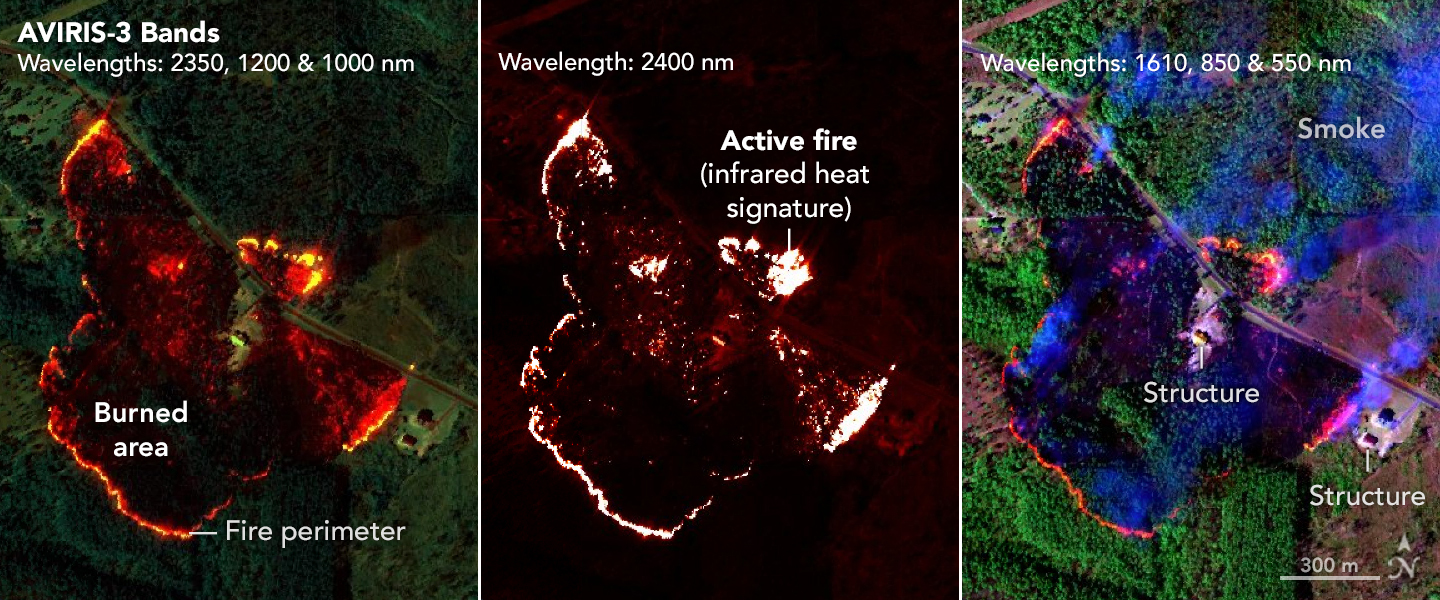
Then, two days after identifying Castleberry Fire hot spots, the sensor spotted a fire about 4 miles (2.5 kilometers) southwest of Perdido, Alabama (above). As forestry officials worked to prevent flames from reaching six nearby buildings, they noticed that the fire’s main hot spot was inside the perimeter and contained. With that intelligence, they decided to shift some resources to fires 25 miles (40 kilometers) away near Mount Vernon, Alabama.
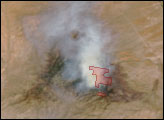
To combat one of the Mount Vernon fires (below), crews used AVIRIS-3 maps to determine where to establish fire breaks beyond the northwestern end of the fire. They ultimately cut the blaze off within about 100 feet (30 meters) of four buildings.
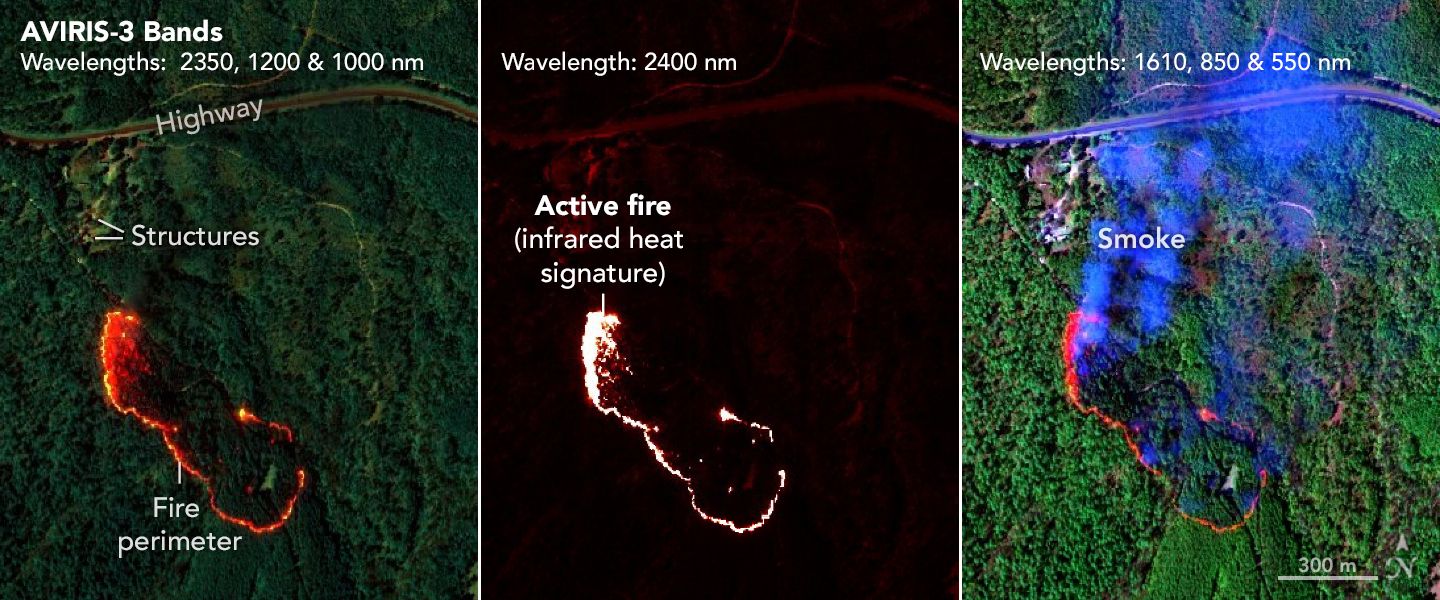
During the March flights, researchers created three types of maps, which are shown above for the Perdido and Mount Vernon fires. One, called the Fire Quicklook (left), combines brightness measurements at three wavelengths of infrared light, which is invisible to the human eye, to identify the relative intensity of burning. Orange and red areas on the Fire Quicklook map show cooler-burning areas, while yellow indicates the most intense flames. Previously burned areas show up as dark red or brown.
Another map type, the Fire 2400 nm Quicklook (middle), looks solely at infrared light at a wavelength of 2,400 nanometers. The images are particularly useful for seeing hot spots and the perimeters of fires, which show brightly against a red background. A third type of map (right), called just Quicklook, shows burned areas and smoke.
The Fire 2400 nm Quicklook was the “fan favorite” among the fire crews, said Ethan Barrett, fire analyst for the Forest Protection Division of the Alabama Forestry Commission. Seeing the outline of a wildfire from above helped Alabama Forestry Commission firefighters determine where to send bulldozers to stop the spread.
Additionally, FireSense personnel analyzed the AVIRIS-3 imagery to create digitized perimeters of the fires. This provided firefighters with fast, comprehensive intelligence of the situation on the ground.
Data from imaging spectrometers like AVIRIS-3 typically takes days or weeks to be processed into highly detailed, multilayer image products used for research. By simplifying the calibration algorithms, researchers were able to process data on a computer aboard the plane in a fraction of the time it otherwise would have taken. Airborne satellite internet connectivity enabled the images to be distributed almost immediately, while the plane was still in flight, rather than after it landed.
“Fire moves a lot faster than a bulldozer, so we have to try to get around it before it overtakes us. These maps show us the hot spots,” Barrett said. “When I get out of the truck, I can say, ‘OK, here’s the perimeter.’ That puts me light-years ahead.”
AVIRIS and the FireSense Airborne Campaign are part of NASA’s work to leverage its expertise with airborne technologies to combat wildfires. The agency also recently demonstrated a prototype from its Advanced Capabilities for Emergency Response Operations project that will provide reliable airspace management for drones and other aircraft operating in the air above wildfires.
NASA Earth Observatory images annotated by Lauren Dauphin using AVIRIS-3 data via the AVIRIS Data Portal. Story by Andrew Wang, adapted for NASA Earth Observatory.