At about 12:50 p.m. local time on March 28, 2025, a magnitude 7.7 earthquake started near the city of Mandalay, Burma (Myanmar). Twelve minutes later, the region shook again from a magnitude 6.7 quake with an epicenter about 31 kilometers (19 miles) to the south.
Originating at a depth of 10 kilometers (6 miles) on the Sagaing Fault, the earthquakes triggered intense shaking and building collapse near the epicenters. Infrastructure damage occurred as far away as Bangkok, Thailand, about 1,000 kilometers (600 miles) to the southeast.
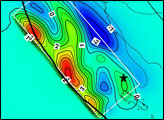
Researchers at NASA’s Jet Propulsion Laboratory in Southern California used data from radar and optical satellites to visualize how the land moved during these quakes. In the map above, red pixels indicate northward motion, while blue pixels show movement to the south. The data highlights ground displacements of more than 3 meters (10 feet) along portions of the fault, for a total offset of more than 6 meters in some places.
The map is based on data from the Advanced Rapid Imaging and Analysis (ARIA) team at JPL and the California Institute of Technology’s Seismological Laboratory, a team that develops state-of-the-art deformation measurements, change detection methods, and physical models for use in hazards science and response.
The ARIA team drew from radar and optical data acquired by the European Space Agency’s Copernicus Sentinel-1A and Sentinel-2B/C satellites. Sentinel-1A employs synthetic aperture radar (SAR) to image the land surface using microwave pulses, while the Sentinel-2 satellites acquire optical data through an onboard multispectral sensor. Using data from the three satellites, the ARIA team computed estimates of horizontal ground motion within the earthquake rupture zone by tracking pixel offsets between pre- and post-earthquake images.
Models produced by the U.S. Geological Survey (USGS) indicated the earthquakes likely resulted from strike-slip motion along the north-south-oriented Sagaing Fault, which is at the interface between the Indian and Eurasian tectonic plates. The data in the image confirm right lateral strike-slip motion along the fault and help to constrain modeled estimates of fault rupture extent and surface displacement due to the earthquakes.
This region has a history of significant seismicity, with six earthquakes of greater than 7.0 magnitude occurring within about 250 kilometers (150 miles) of the March 28 quakes since 1900, according to the USGS. The surface rupture generated by the March 28 earthquakes has been estimated, based in part on the data shown, to span 550 kilometers (342 miles) in length. With a rupture extending from north of Mandalay to south of Burma’s capital, Nay Pyi Taw, it is one of the longest documented strike-slip fault-induced surface ruptures on record.
Preliminary analyses of the rupture by other scientists found that, in addition to being especially long, it was also remarkably fast, suggesting it may have been a rare “supershear” earthquake. In these events, the slip along the fault moves faster than the seismic waves it produces, which can concentrate seismic energy ahead of the rupture. The effect may exacerbate a quake’s destructive forces and might be part of the reason why the recent events caused so much damage so far from the epicenters.
NASA Earth Observatory map by Michala Garrison, using data provided by the ARIA team at NASA/JPL-Caltech. The map is based on Sentinel-1A and Sentinel-2B/C data provided by the European Space Agency and processed by ARIA team members Robert Zinke and Cole Speed (JPL). Story by Andrew Wang (JPL) and Lindsey Doermann. Science review by Grace Bato and Eric Fielding (JPL).