
In 2024, global temperatures for June through August were the hottest on record, narrowly topping the same period in 2023. The exceptional heat extended throughout other seasons, too, with global temperatures breaking records for 15 straight months from June 2023 until August 2024, according to scientists from NASA’s Goddard Institute for Space Studies (GISS).
Although this spell of record heat fits within a long-term warming trend driven by human activity—primarily greenhouse gas emissions—the intensity of the heat, which reached a crescendo in the last half of 2023, surprised leading climate scientists. In a commentary in Nature, Gavin Schmidt, the director of GISS, used words like “humbling” and “confounding” to explain just how far temperatures overshot expectations during that period.
The charts on this page show how much global temperatures in 2023 and 2024 diverged from expectations based on NASA’s temperature record. Roughly a year later, Schmidt and other climatologists are still trying to understand why.
“Warming in 2023 was head-and-shoulders above any other year, and 2024 will be as well,” Schmidt said. “I wish I knew why, but I don’t. We’re still in the process of assessing what happened and if we are seeing a shift in how the climate system operates.”
Earth’s air and ocean temperatures during a given year typically reflect a combination of long-term trends, such as those associated with climate change, and shorter-term influences, such as volcanic activity, solar activity, and the state of the ocean.
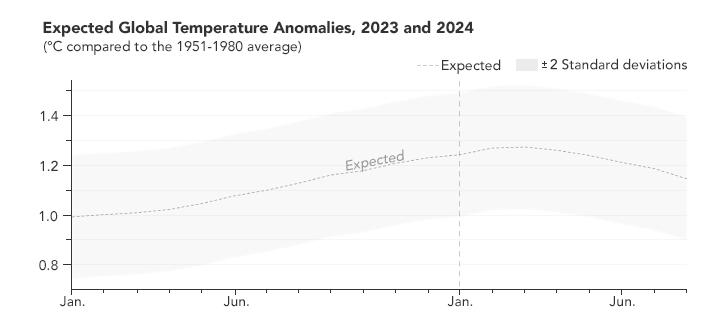
In late 2022, as he has done each year since 2016, Schmidt used a statistical model to project global temperatures for the coming year. La Niña—which cools sea surface temperatures in the tropical Pacific—was present for the first part of 2023 and should have taken the edge off global temperatures. Schmidt calculated that average 2023 global temperatures would reach about 1.22 degrees Celsius above the baseline, putting it in the top three or four warmest years, but that it would not be a record-breaking year. Scientists at the UK Met Office, Berkeley Earth, and Carbon Brief made similar assessments using a variety of methods.

This chart shows Schmidt’s expectation for how much monthly temperatures from January 2023 to August 2024 would differ from NASA’s 1951-1980 baseline (also known as an anomaly). The expectation (represented as the dashed line in the chart) was based on an equation that calculates global average temperature based on the most recent 20-year rate of warming (about 0.25°C per decade) and NOAA’s sea surface temperature measurements from the tropical Pacific, accounting for a three-month delay for these temperatures to affect the global average. The shaded area shows the range of variability (plus or minus two standard deviations).
“More complex global climate models are helpful to predict long-term warming, but statistical models like these help us project year-to-year variability, which is often dominated by El Niño and La Niña events,” said Zeke Hausfather, a climate scientist at the University of California, Berkeley. Hausfather helps produce the Berkeley Earth global temperature record and also generates annual predictions of global temperature changes based on those data.
Schmidt’s statistical model—which successfully predicted the global average temperature every year since 2016—underestimated the exceptional heat in 2023, as did the methods used by Hausfather and other climatologists. Schmidt expected global temperature anomalies to peak in February or March 2024 as a lagged response to the additional warming from El Niño. Instead, the anomalous heat emerged well before El Niño had peaked. And the heat came with unexpected intensity—first in the North Atlantic Ocean and then virtually everywhere.
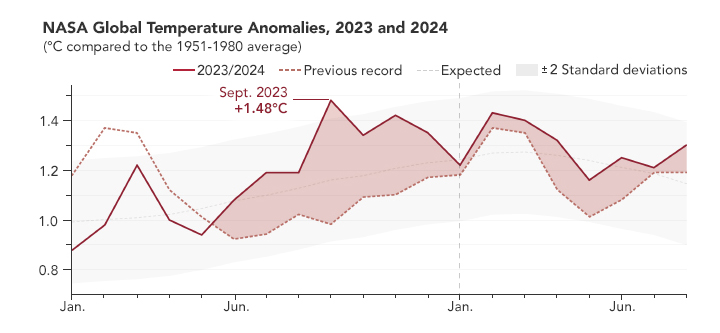
“In September, the record was broken by an absolutely astonishing 0.5 degrees Celsius,” Schmidt said. “That has not happened before in the GISS record.”

The chart above shows how global temperatures calculated from January 2023 to August 2024 differed from NASA’s baseline (1951–1980). The previous record temperature anomalies for each month—set in 2016 and 2020—are indicated by the red dashed line. Starting in June 2023, temperatures exceeded previous records by 0.3 to 0.5°C every month. Although temperature anomalies in 2024 were closer to past anomalies, they continued to break records through August 2024. The global average temperature in September 2024 was 1.26°C above NASA’s baseline—lower than September 2023 but still 0.3°C above any September in the record prior to 2023.
To calculate Earth’s global average temperature changes, NASA scientists analyze data from tens of thousands of meteorological stations on land, plus thousands of instruments on ships and buoys on the ocean surface. The GISS team analyzes this information using methods that account for the varied spacing of temperature stations around the globe and for urban heating effects that could skew the calculations.
Since May 2024, Schmidt has been compiling research about possible contributors to the unexpected warmth, including changes in greenhouse gas emissions, incoming radiation from the Sun, airborne particles called aerosols, and cloud cover, as well as the impact of the 2022 Hunga Tonga-Hunga Ha’apai volcanic eruption. However, none of these factors provide what Schmidt and other scientists consider a convincing explanation for the unusual heat in 2023.
Atmospheric greenhouse gas levels have continued to rise, but Schmidt estimates that the extra load since 2022 only accounted for additional warming of about 0.02°C. The Sun was nearing peak activity in 2023, but its roughly 11-year cycle is well measured and not enough to explain the temperature surge either.
Major volcanic eruptions, such as El Chichón in 1982 and Pinatubo in 1991, have caused brief periods of global cooling in the past by lofting aerosols into the stratosphere. And research published in 2024 indicates the eruption in Tonga had a net cooling effect in 2022 and 2023. “If that’s the case, there’s even more warming in the system that needs to be explained,” Schmidt said.
Another possible contributor is reduced air pollution. A research team led by Tianle Yuan, an atmospheric research scientist at NASA’s Goddard Space Flight Center, has found a significant drop in aerosol pollution from shipping since 2020. The drop coincides with new international regulations on sulfur content in shipping fuels and with sporadic drops in shipping due to the coronavirus pandemic.
Sulfur aerosol emissions promote the formation of bright clouds that reflect incoming sunlight back to space and have a net cooling effect. Reducing this pollution has the opposite effect: clouds are less likely to form, which could warm the climate. Although scientists, including Yuan, generally agree that the drop in sulfur emissions likely caused a net warming in 2023, the scientific community continues to debate the precise size of the effect.
“All of these factors explain, perhaps, a tenth of a degree in warming,” Schmidt said. “Even after taking all plausible explanations into account, the divergence between expected and observed annual mean temperatures in 2023 remains near 0.2°C—roughly the gap between the previous and current annual record.”
Both Hausfather and Schmidt expressed concern that these unexpected temperature changes could signal a shift in how the climate system functions. It could also be some combination of climate variability and a change in the system, Schmidt said. “It doesn’t have to be an either-or.”
One of the biggest uncertainties in the climate system is how aerosols affect cloud formation, which in turn affects the amount of radiation reflected back to space. However, one challenge for scientists trying to piece together what happened in 2023 is the lack of updated global aerosol emissions data. “Reliable assessments of aerosol emissions depend on networks of mostly volunteer-driven efforts, and it could be a year or more before the full data from 2023 are available,” Schmidt said.
NASA’s PACE (Plankton, Aerosol, Cloud, ocean Ecosystem) satellite, which launched in February 2024, could help shed light on these uncertainties. The satellite will help scientists make a global assessment of the composition of various aerosol particles in the atmosphere. PACE data may also help scientists understand cloud properties and how aerosols influence cloud formation, which is essential to creating accurate climate models.
Schmidt and Hausfather invite scientists to discuss research related to the contributors of the 2023 heat at a session they are convening at the fall meeting of the American Geophysical Union in Washington, D.C., on December 9–13, 2024.
NASA Earth Observatory map and charts by Michala Garrison, based on data from the NASA Goddard Institute for Space Studies. Climate spiral visualization by Mark SubbaRao, NASA Goddard Space Flight Center/Scientific Visualization Studio. Story by Emily Cassidy.