
In 2019-2020, eastern Africa experienced its worst desert locust invasion in more than 40 years. The United Nations and its partners treated more than 17,000 square kilometers (6,600 square miles) of locust infestations across ten countries with various eradication methods. Countless crops were still devoured by the insects, causing serious food insecurity in the region.
As the outbreaks grew and migrated, NASA-funded researchers worked to better forecast when and where the swarms would appear. In a recently published study, the team showed that by examining soil moisture and soil composition, they could predict optimal breeding sites 85 percent of the time.
“We looked at soil moisture and texture because those are critical components to the locust life cycle,” said Lee Ellenburg, the food security and agriculture lead for NASA’s SERVIR program and the study’s lead author. “We are essentially identifying where the locusts are breeding.”
The most effective time to eradicate desert locusts (Schistocerca gregaria) are when the insects are in the egg and hopper phases, a period when they are still developing wings and have limited mobility. Females tend to lay eggs in warm, wet, and sandy-clay soils at a depth of 10 to 15 centimeters (4 to 6 inches) below the surface.
In roughly two to four months, the locusts mature and develop wings, at which point it becomes difficult to find and eradicate them. Adults can fly more than 150 kilometers (90 miles) per day; swarms can even cross the Red Sea, as they did in 2019-2020. Just one square kilometer of a locust swarm can contain as many as 80 million adult locusts.

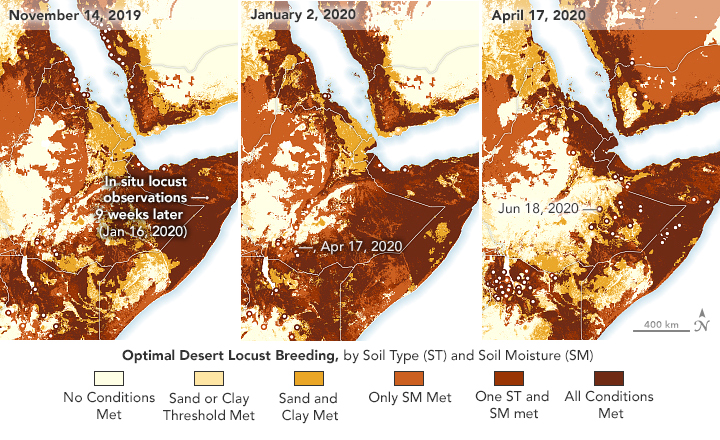
The maps on this page show various soil moisture and texture conditions—key features of potential breeding sites—before major outbreaks occurred in eastern Africa in 2020. The darkest shade indicates optimal soil moisture and textures (an ideal mix of sand and clay) for locust breeding. The lightest shade indicates areas with poor breeding conditions. The white dots show locust swarm observations recorded by the UN Food and Agriculture Organization (FAO) Locust Hub platform in the weeks after the soil measurements.
“Knowing the life cycle of the locust and the temperatures in the region, we can backtrack and estimate when those locusts were hatching and what the soil conditions were,” said Ellenburg. “We found that we can detect the optimal breeding conditions and accurately predict where the swarms will appear up to nine weeks ahead of time.”
The map at the top of this page shows soil conditions on April 17, 2020, overlaid from locust observations from June 18, 2020, when infestations increased in Kenya. The subsequent three maps show the progression of the locust infestations, starting around Saudi Arabia, migrating toward Eritrea and Ethiopia, and then concentrating in Kenya. Soil moisture data was modeled using NASA’s Land Information System, and soil texture data came from the International Soil Reference and Information Centre.
During the outbreaks, the research team shared soil condition products with FAO and PlantVillage, which created a crowdsourcing application to allow government personnel and trained citizens to catalog locust sightings. PlantVillage used the soil moisture data to help prioritize areas for surveying.
The SERVIR team is now working to integrate their soil condition products into the FAO locust support dashboard, which includes other relevant factors such as wind patterns, temperatures, and vegetation. The goal is to be better prepared for the next major locust invasion, said Catherine Nakalembe, a food security researcher with SERVIR and NASA Harvest. Once optimal breeding grounds are identified, officials can spray pesticides and administer insect growth regulators in the area to kill the eggs and hoppers.
“If this were to happen again in two years, we don’t want to be scrambling for information,” said Nakalembe. “These satellite datasets and ground information help us with tracking, understanding, and providing necessary early warnings about how bad conditions may get.”
NASA Earth Observatory images by Lauren Dauphin, using data from Ellenburg, W. Lee, et al. (2021). Story by Kasha Patel.