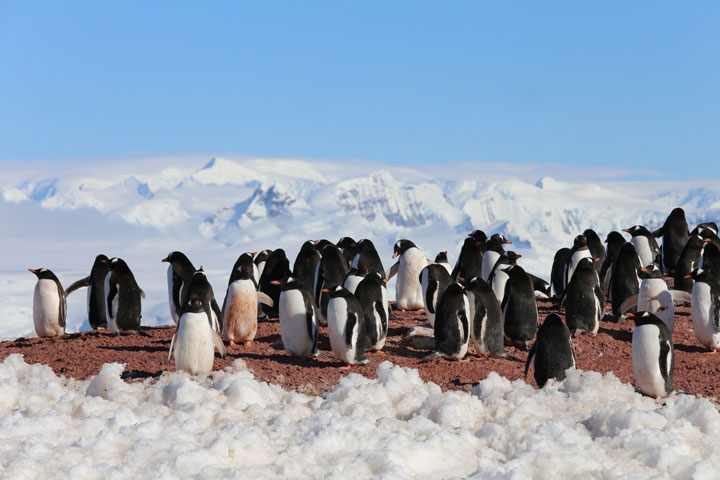


Recent censuses of the tuxedoed inhabitants of the Antarctic Peninsula have shown intriguing differences between species. Populations of Adélie and chinstrap penguins are declining, while populations of gentoo penguins are growing. Remote sensing data are helping scientists figure out why.
“The gentoo penguin is a climate change winner, with populations moving farther south than we have ever seen them,” said Michael Wethington, a graduate student at Stony Brook University. “New colonies generally happen very rarely, but we have spotted a slew of new ones in past five to ten years.”
Wethington thinks gentoo penguins might be taking advantage of food sources farther south along the peninsula—a move that requires sea ice conditions to be just right. Populations of krill, a staple of the penguin diet, flourish where there is ample sea ice. But suitable penguin habitat requires at least some openings in the ice where they can access the ocean to hunt and forage. And because gentoos overwinter near their summer breeding colonies, their survival each year depends on nearby “hunting holes” that stay open throughout the cold, dark austral winter.
“To understand penguin habitat, it is important to understand what is happening with sea ice dynamics surrounding their colonies,” Wethington said. “Satellite data are enabling us to identify and better understand the locations where open water foraging habitat exist and the trends throughout the year.”
During sunlit months, light reflected from Earth’s surface allows passive satellite sensors to collect images of sea ice and the various cracks or fractures (leads) where there is open water. But the lack of sunlight during the winter months means these sensors cannot observe these surface features, leaving scientists in the dark about penguin habitat.
Winter darkness is not a problem for NASA’s Ice, Cloud and land Elevation Satellite-2 (ICESat-2). The satellite carries a laser altimeter that uses pulses of light to precisely measure the height of the first substance it hits, whether that’s open water or sea ice. Open water within a lead shows up in the satellite data as a very flat surface, as opposed to the comparatively textured surface of sea ice. These data provide a high-resolution look at the location and width of leads in the sea ice.
“This approach represents a new chapter of using active remote sensing to better understand the environmental drivers impacting populations during a time of year that has so often remained a mystery to researchers,” Wethington said.

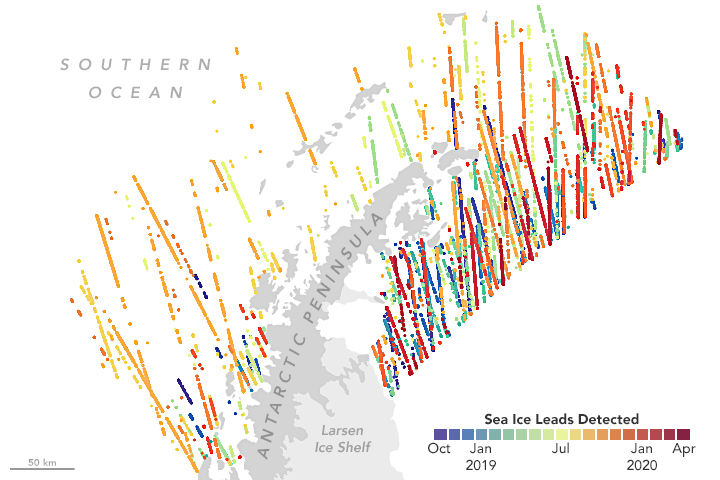
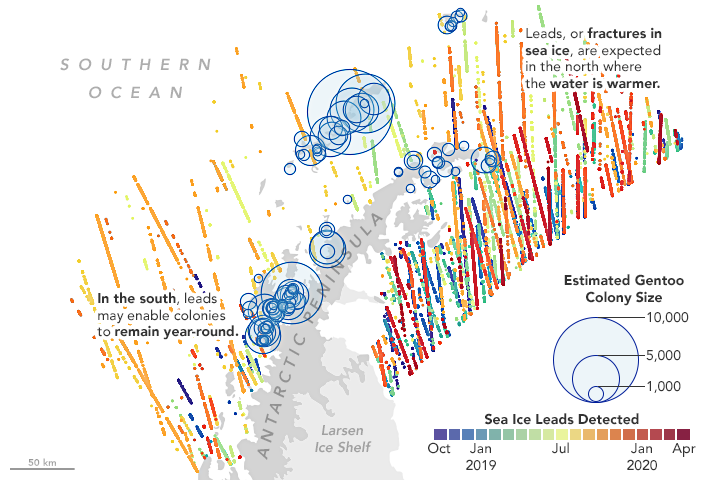
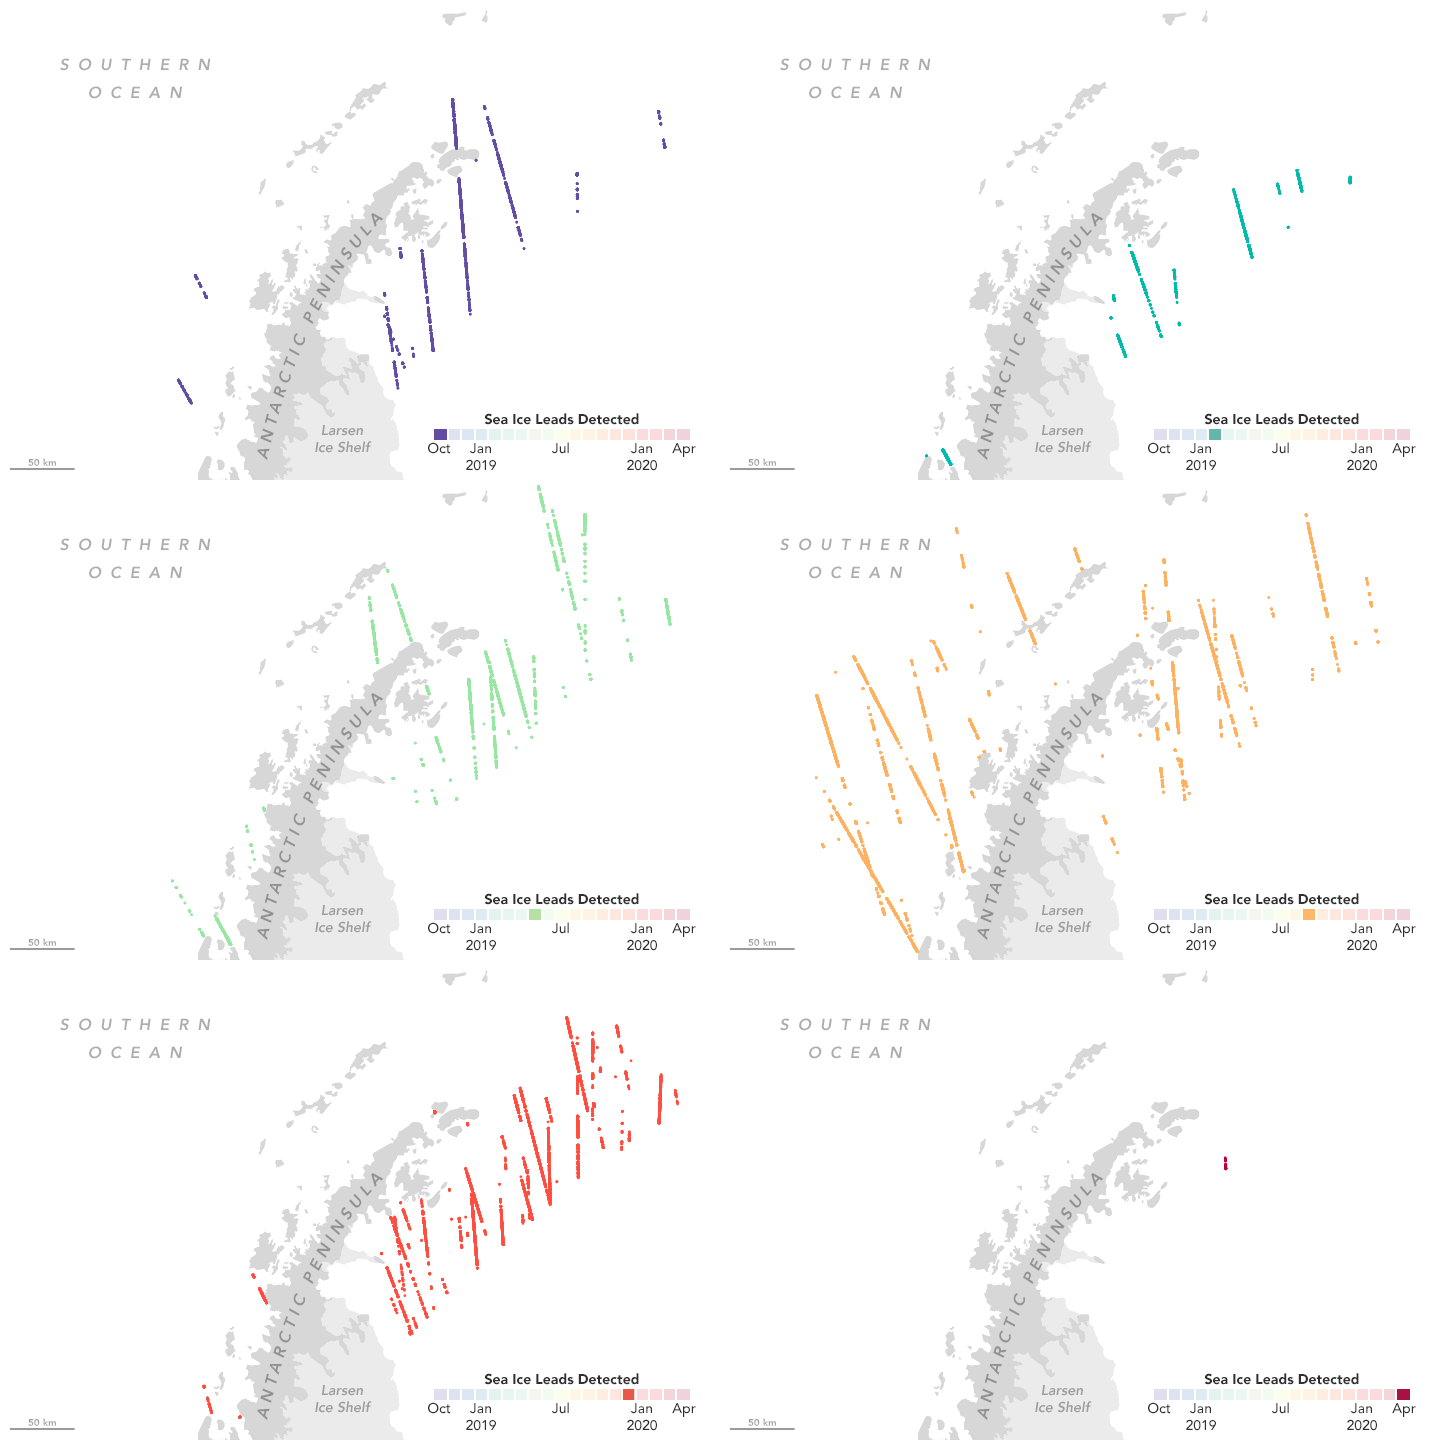
On the maps on this page, lines indicate where ICESat-2 detected leads in the sea ice around the Antarctic Peninsula from October 2019 through April 2020. Each point on the lines represents a location along the satellite’s orbital path where the sensor detected open water. Wethington filtered the data by month to find out which areas have more leads and how those dynamics change.
The maps show more leads and open water in the northern reaches of the peninsula, which makes sense because temperatures generally warm as you move toward the equator. “What we can also see is that open-water habitat certainly exists around the more southern gentoo colonies,” Wethington said, “suggesting that the individuals founding new colonies might be able to remain at those locations throughout the year.”

Wethington said the next step in the investigation involves building a statistical model to investigate how lead density and proximity to penguin colonies affect population trends from year to year, as well as their importance for enabling new colonies to be established.
“This was a really nice and unique use of ICESat-2 data,” said Nathan Kurtz, a sea ice scientist at NASA’s Goddard Space Flight Center and deputy project scientist for ICESat-2. “Studies like this weren’t part of the primary science objectives from ICESat-2, but it has been very interesting to see what new types of science can be done to understand different aspects of our planet.”
NASA Earth Observatory images by Joshua Stevens, using ICESat-2 data and colony estimates courtesy of Michael Wethington/Stony Brook University. Photo by Yvette Zhang on Unsplash. Story by Kathryn Hansen.