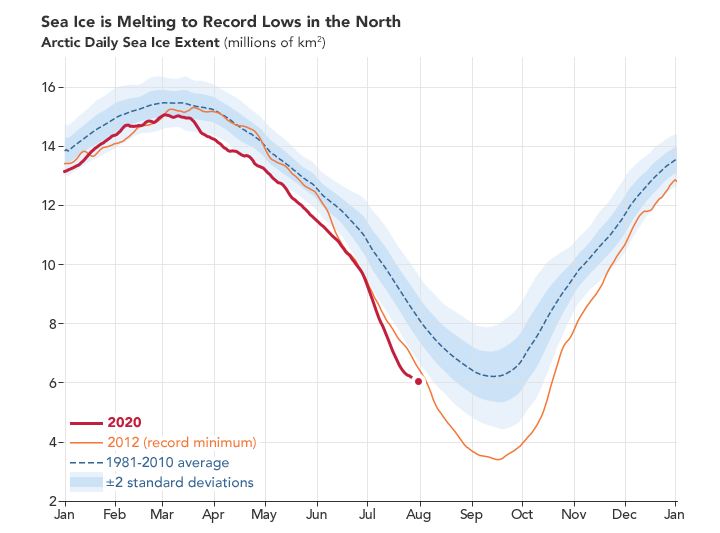

The 2020 melting season still has at least another month to gnaw away at Arctic sea ice, but it has already consumed a lot. In July, the ice cover spanning the Arctic Ocean reached a record-low extent for this time of year.
The maps above show the sea ice extent in the Arctic Ocean for July 2020 (above, right) in context with sea ice from July 2000 and 2010. Extent is defined as the total area in which the ice concentration is at least 15 percent—the minimum amount at which space-based measurements give a reliable measurement. The yellow outline on each map shows the 30-year median extent for the month.
In July 2020, the ice extent averaged 7.28 million square kilometers (2.81 million square miles), making it the lowest for July since the start of satellite measurements in 1979. The July 2020 extent is 2.19 million square kilometers below the 1981-2010 average for the month, and 310,000 square kilometers below the previous record low, set in 2019. For context, the ice extent in July 2000 was close to the 1981-2010 average, and July 2010 measured 1.4 million square kilometers below average.
Unusually warm air temperatures in May and June over Siberia set the stage for rapid melting in the East Siberian and Laptev Seas, while ocean currents helped flush ice out from the Russian Arctic coast—opening the Northern Sea Route. In contrast, sea ice in the Chukchi and Bering seas was closer to normal in July.

In any given year, there are regional variations in air temperatures, water temperatures, and weather that promote or inhibit melting in different parts of the Arctic. But in the context of the long-term record, sea ice has been declining in every geographic area and in every month and season.
There are no guarantees about how the remainder of the 2020 melt season will play out; a lot can happen between July and the end of September. For example, sea ice in 2019 reached a record-low for July, but then ended up tied for the second-lowest annual minimum in mid-September.
At the start of August 2020, scientists were observing an atmospheric low-pressure system over the Arctic Ocean and wondering how it would affect the ice. The storm is visible in the image below, acquired on July 28, 2020, by the Moderate Resolution Imaging Spectroradiometer (MODIS) on NASA’s Terra and Aqua satellites.
.“Historically these summer storms have been pretty key for determining how low the ice extent gets come September, the month of the sea ice minimum,” said Alek Petty, a sea ice scientist NASA’s Goddard Space Flight Center. “What we’re looking for is how strong they are (how low is the low?), where they are, how long they stay in the Arctic, and how the sea ice responds.”
Perhaps the most notable low-pressure system in recent years was the “great Arctic cyclone of August 2012.” After analyzing that storm, Goddard sea ice scientists Claire Parkinson and Josefino Comiso published an analysis pointing to it as a leading contributor to the lowest sea ice minimum on record, reached on September 13, 2012.
The effects of cyclonic storms in the Arctic can be complex. On one hand, they can increase melting by importing heat and moisture from lower latitudes. They can also break up the ice making it more easily eroded by wind, waves, and warm ocean water. But on the other hand, the high winds can spread ice out across the Arctic, and the clouds can shield the ice from sunlight.
This storm looked to be pretty significant at the start, as it had similar strength to the 2012 storm. But the 2012 storm lasted weeks and it occurred later in the melt season. “I think a lot depends on how long this lasts and how much it weakens the ice cover,” Petty said. “We are watching this one, and others that might follow.”
NASA Earth Observatory images by Joshua Stevens, using data from the National Snow and Ice Data Center and MODIS data from NASA EOSDIS/LANCE and GIBS/Worldview. Story by Kathryn Hansen.