
It is not even summertime, but already the United Kingdom has seen a significant number of wildfires. The map above shows cumulative fire detections across the United Kingdom from January 1 through April 30, 2019. The data come from the Visible Infrared Imaging Radiometer Suite (VIIRS) on the Suomi NPP satellite.
Each red dot depicts one fire detection from the VIIRS 375-meter active fire data product. A “fire detection” is a pixel in which the sensor and an algorithm indicated there was active fire on any given day. Many fire detections can be generated by a single burning fire.
Notable fires this year include blazes in February and April in England’s Ashdown Forest—the setting that inspired the Hundred Acre Wood in A.A. Milne’s Winnie the Pooh stories. In late February, following the United Kingdom’s warmest winter day on record, the Marsden Moor fire burned in West Yorkshire, England. Scotland has seen burning too, including a major wildfire that burned near a wind farm in Moray.

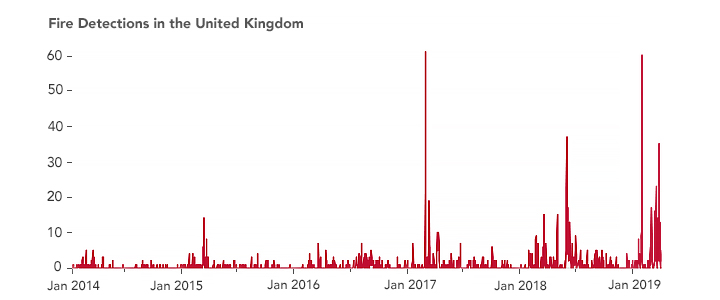
The chart above shows that there is a seasonal trend to the number of fire detections. Vegetation that was previously frozen and dried during the winter becomes fuel for wildfires during spring and summer months.
Notice that there have been more fire detections since 2017 compared with previous years. According to the annual report on forest fires by the European Commission’s Joint Research Center, warm, dry weather was responsible for the rise in wildfire numbers across the United Kingdom in 2017. A similar situation played out in 2018.
“Drier-than-normal conditions can boost fire detections in two ways,” said Wilfrid Schroeder, a scientist at the University of Maryland and principal investigator for the VIIRS active fire product. He noted that dry conditions favor the ignition and spread of fire. There also tends to be less cloud coverage, making fires more likely to be detected from space.
High fire counts and warm, dry weather have been a continuing trend. By the end of April 2019, the United Kingdom had already seen more fires through this point in the year than in the record-breaking year of 2018.
NASA Earth Observatory images by Lauren Dauphin, using VIIRS data from the Suomi National Polar-orbiting Partnership. Story by Kathryn Hansen.