

In July 2018, a spark near the Mendocino National Forest ignited California’s largest wildfire on record. As the fire spread rapidly, officials declared mandatory evacuations in several areas and counties. But where did people go, when did they leave, and when did they return? Researchers have turned to a new data source to observe population movements during a crisis: social media.
“We wanted to analyze evacuation patterns and factors that can influence the speed of evacuations during a crisis,” said Shenyue Jia, a remote sensing specialist at Chapman University.
Analyzing evacuation and recovery patterns could help researchers understand how humans behave in the face of a disaster, which could inform emergency response efforts. Jia said nobody was able to provide population movements during a disaster, especially at a high temporal and spatial resolution—until Facebook.
Almost 2.5 billion people per month actively use Facebook. When a disaster strikes, many of those users log on during an evacuation. Facebook’s disasters map initiative uses aggregated, anonymized Facebook data in disaster areas to estimate population densities, movements between neighborhoods, and where people mark themselves as “safe” during a crisis. The company also works with mobile phone carriers to observe the number of connections to surrounding cell phone towers.

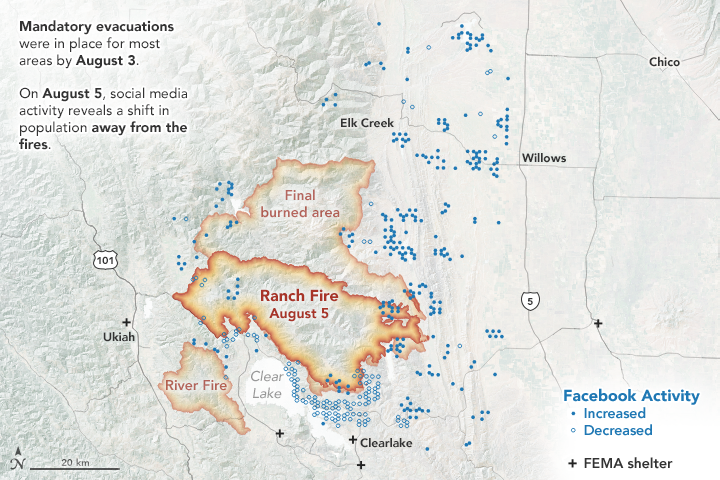
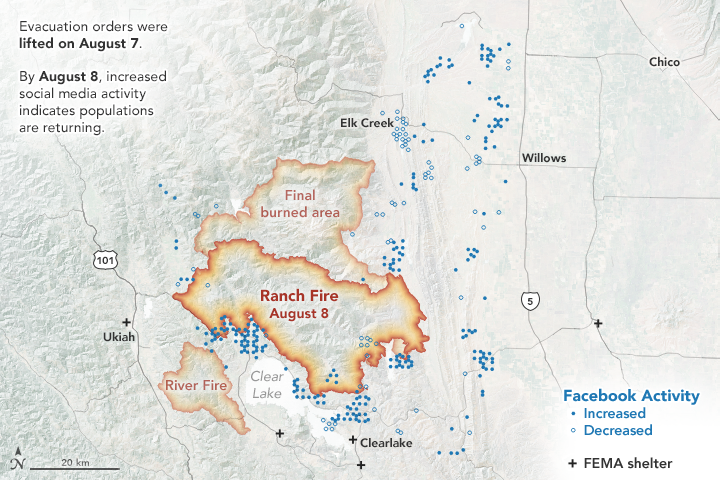
The images on this page show the population data during the Mendocino Complex Fire in Northern California for 10,000 people, as provided by the Facebook disaster map dataset. The first map above shows the area on August 5, 2018, two days after mandatory evacuations were in place. The second map below shows the area on August 8, one day after the evacuation orders were lifted.
During the Mendocino Complex fire, most people fled the fire perimeter when an evacuation was in place, which was not surprising. But what surprised Jia was where people were headed—or not headed.
“Originally, I thought this data could be nice to track which places people decide to go, but the information didn't show any significant pattern for this fire,” said Jia, whose research was funded by NASA. “I was expecting a very simple trend, but evacuations are more complicated to understand.”
Jia thinks that perhaps people had more shelter options to flee to (FEMA shelters, neighboring towns, etc.), so the evacuation patterns were dispersed.
However, when the evacuations were lifted, the data showed a much clearer trend of where people were headed: most were returning back to their homes and hometowns. Jia said that how the population bounces back post-disaster is an important indicator of whether the evacuated areas may be safe for residing. In the Mendocino Complex fire, most areas saw people returning.
But that’s not always the case. Jia also analyzed population data from Facebook for the Camp Fire that occurred in November 2018. The data showed a large portion of the evacuated area did not see a sustainable population return since many of those areas were destroyed.
“This research demonstrates that social-network data can be a valuable tool to monitor human behaviors in response to disasters, such as wildfires in areas that have been exacerbated by urbanization,” said Son Nghiem, remote sensing expert at NASA’s Jet Propulsion Laboratory, who oversaw this research.
According to Nghiem, this frequently updated social media data can add another dimension to satellite remote sensing data from NASA and other international agencies used to monitor land cover and land use change.
“With remote sensing data, we don’t know the immediate socioeconomic and demographic impacts,” said Nghiem. “This innovative use of demographic data opens up new possibilities to advance research on how humans respond to abrupt physical changes in disaster situations.”
NASA Earth Observatory images by Joshua Stevens, using data courtesy of Shenyue Jia/Chapman University. Story by Kasha Patel.